
Explore Productsended
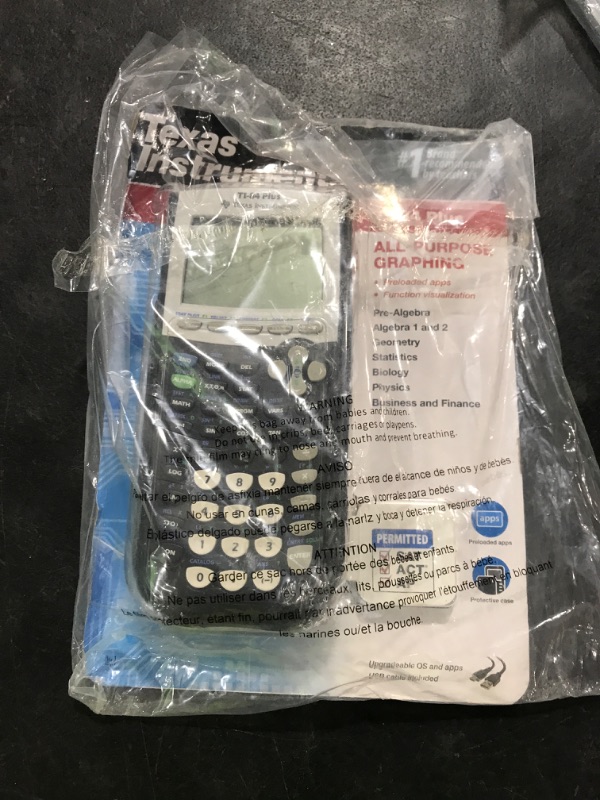
Texas Instruments Ti-84 plus Graphing calculator - Black
Texas Instruments Ti-84 plus Graphing calculator - Black

Description
The all-purpose TI-84 Plus graphing calculator features more than a dozen preloaded apps including functionality that encourages exploration of interactive geometry, inequality graphing, and real-world data collection and analysis. Ideal for middle school through college.
Item Details
Pickup Location
4031 Market Center Dr Suite 303
North Las Vegas, NV, 89030
Quality
New
Functional
No Damage
No Assembly Needed
In Package
No Missing Parts
brand
Texas InstrumentsEstimated Retail Price
$89.98
color
Blacksize
Smallweight
0.44 lbsBuyers Premium
15%
Inventory Number
1046430923
Features
- Real and complex numbers calculated to 14-digit accuracy and displayed with 10 digits plus a 2-digit exponent. Graphs 10 rectangular functions, 6 parametric expressions, 6 polar expressions, and 3 recursively-defined sequences. Up to 10 graphing functions defined, saved, graphed, and analyzed at one time.
- Sequence graphing mode shows time series plot, cobweb/stair-step plot, and phase plots. User-defined list names. Lists store up to 999 elements. 14 interactive zoom features. Numeric evaluations given in table format for all graphing modes.
- Interactive analysis of function values, roots, maximums, minimums, integrals, and derivatives. 7 different graph styles for differentiating the look of each graph drawn. Horizontal and vertical split- screen options. Stores up to 10 - 50x50 matrices.
- Matrix operations including inverse, determinant, transpose, augment, reduced row echelon form, and elementary row operations. Convert matrices to lists and vice-versa. List-based one- and two-variable statistical analysis, including logistic, sinusoidal, median-median, linear, logarithmic, exponential, power, quadratic polynomial, cubic polynomial, and quartic polynomial regression models.
- 3 statistical plot definitions for scatter plots, xy-line plots, histograms, regular and modified box-and-whisker plots, and normal probability plots. Advanced statistics features including 9 hypothesis testing functions, 6 confidence interval functions, and one-way analysis of variance..Features: 200+ functions, multi-line display
Online Reviews
4.6/5
Based on 2161 ratings
This score is based on 2161 recent reviews from online retailers.
Be sure to check our Quality Rating and Notes above for more details on this listing.
See the deals
Get in on the action, thousands of new items added daily. Bid and win!
Start bidding now